import pandas as pdimport numpy as npimport matplotlib.pyplot as pltfrom sklearn.compose import ColumnTransformerfrom sklearn.pipeline import Pipelinefrom sklearn.preprocessing import StandardScalerfrom sklearn.linear_model import LogisticRegressionpd.set_option("display.max_columns", None)
Introduction
Logistic regressions, also referred to as a logit models, are powerful alternatives to linear regressions that allow one to model a binary outcome (i.e., 0 or 1) and provide notably accurate predictions on the probability of said outcome occurring given an observation. The parameter estimates within logit models can provide insights into how different explanatory variables, or features, contribute to the model predictions. Many readers are likely familiar with interpreting logit model parameters in terms of odds ratios (if not don’t worry, I briefly cover this below). Nevertheless, the interpretation of these parameters in terms of probabilities is not as straightforward, but a robust understanding of how to interpret these parameters can provide an immense amount of intuition into explaining the model’s underlying predictive behavior.
Making a prediction is extremely powerful, but intuitively explaining the predictive components of a model in real world terms can take your project analysis to the next level.
By the end of this article you will see logistic regression in a new light and gain an understanding of how to explain the model parameters with a staggering amount of intuition. This article assumes a brief underlying knowledge of logit models and thus directs focus more intently on interpreting the model parameters in a comprehensible manner. Nevertheless, we will first briefly discuss the theory behind logit models. We will then give an in-depth discussion into how to interpret the model parameters as marginal effects. Lastly, we will cover a practical example predicting fraudulent credit card transactions utilizing the following Kaggle dataset.
Logistic Regression Crash Course
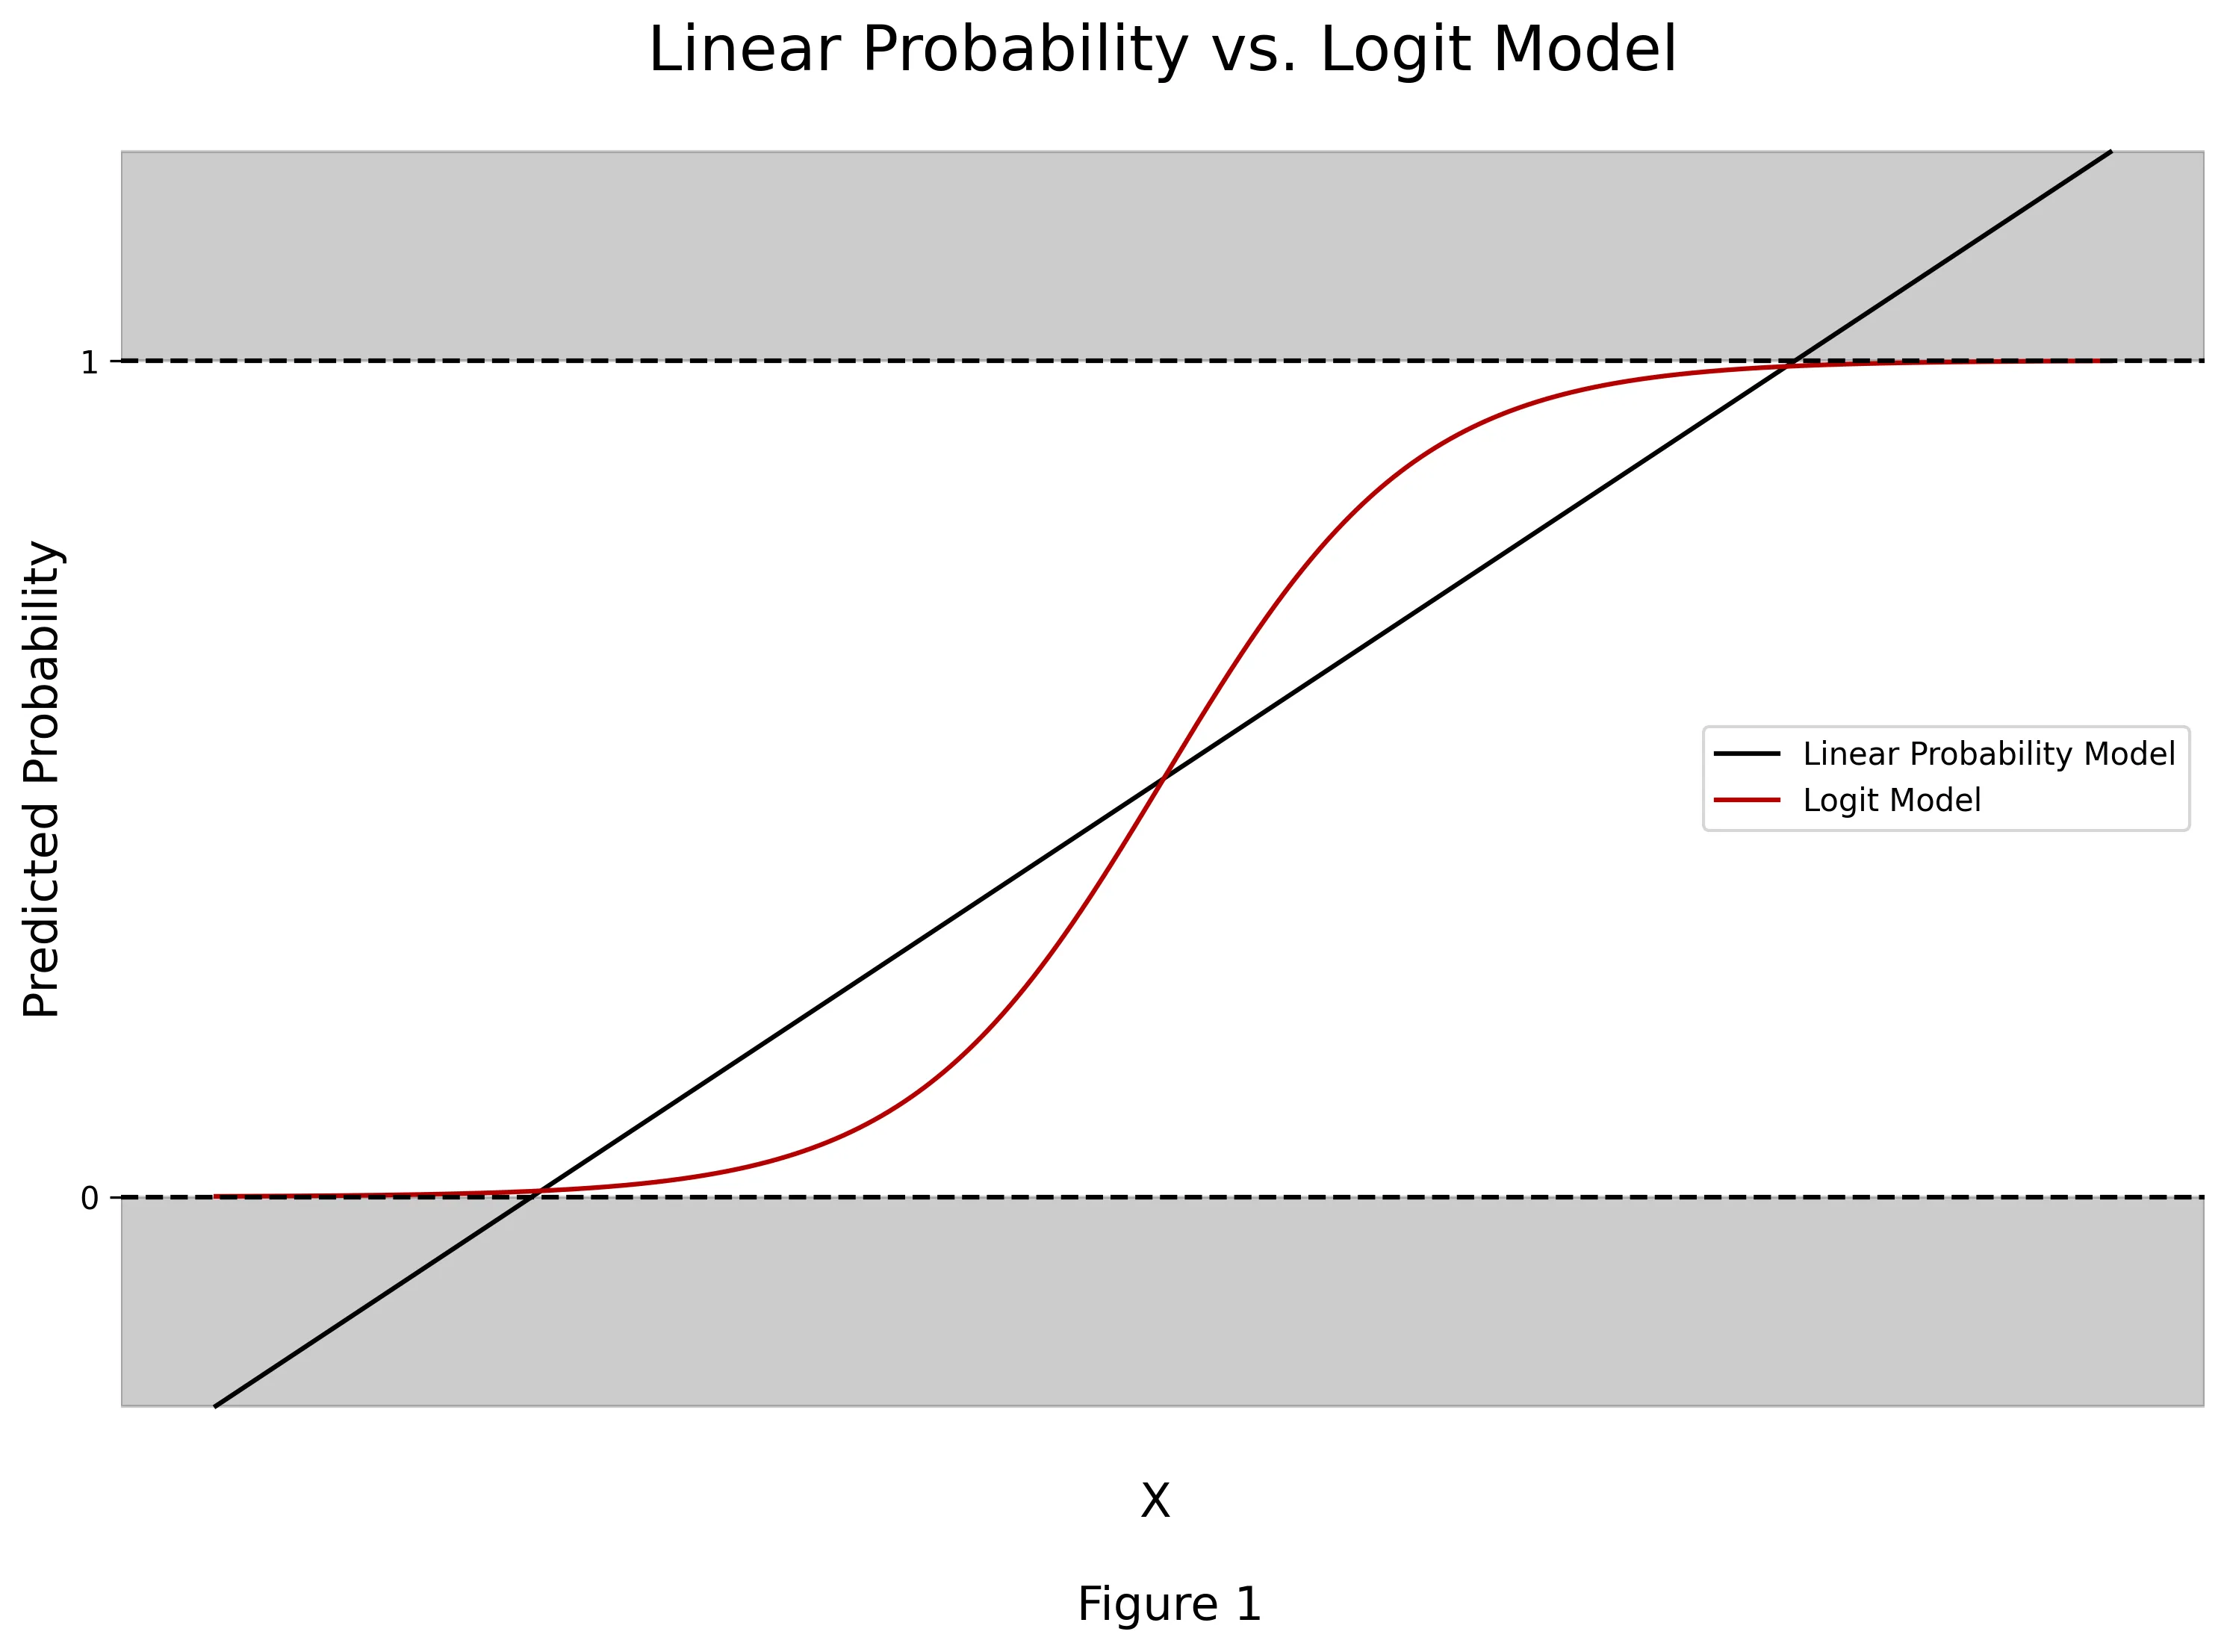
Logit Models belong to a more broad family of generalized linear models (GLMs) that, in brief, allow for flexible fitting of linear models when the outcome of interest follows a different underlying distribution than gaussian and relates the linear model to the outcome of interest via a link function. The canonical linear regression is a special case where the link function is the identity function. In the binary outcome case, a linear regression, which is referred to as linear probability model, can provide predictions that are less than 0 or greater than 1 (See Figure 1). This clearly poses issues as probabilities are naturally bounded between 0 and 1. However, GLM’s provide a convenient framework to solve this problem!
The logit model is a specific case that allows for the modeling of binary outcomes that follow a Bernoulli distribution. The logit model is particularly attractive because the link function used (logit function) is bounded between 0 and 1. And consequently, all model predictions are bounded between 0 and 1, as anticipated in the probability space. Figure 1 below provides a nice visual comparison between the model fits of linear probability model and logistic regression in a bivariate case.
Where \(X\) denotes the matrix of observed explanatory variables, or features, in the model and \(p(X)\) denotes the probability of \(y\) taking on a value of 1. Given this model setup with y distributed Bernoulli, the goal of logit model estimation is to maximize the following likelihood function, which is our joint distribution:
In simple terms, our optimization problem seeks to choose the parameters (i.e., \(β\) ) in (1) that will maximize (2). Note that (2) will be maximized when the estimated probability is close to 1 for individuals with \(y\) = 1 and close to 0 for individuals with \(y\) = 0. To do so, one can take the log of the likelihood function to obtain the log-likelihood and solve this problem using gradient descent or related algorithms. For more details, the wiki page on logistic regression provides a nice in-depth treatment to logit model estimation.
Interpreting Logit Parameters as Marginal Effects
A marginal effect can be thought of as the average (or marginal) effect on the outcome (or target) variable resulting from a change in the explanatory variable (or feature) of interest. This can similarly be conceptualized as follows: At the average (or marginal) observation/individual, what is the effect of changing an explanatory variable on the outcome. In our case with a binary variable, this would be akin to estimating the average effect of changing an explanatory variable on the probability of observing the outcome.
Caution: Marginal effects must be interpreted only as an association and not as a causal relationship. Causality requires additional identifying assumptions.
By recognizing that the marginal effect is simply a rate of change, one may immediately notice that this boils down to a taking a derivative with respect to the explanatory variable. We will first start with the simple linear regression case to make things easy. Suppose we have the following linear regression:
In order to find the marginal effect of any variable, we can take the derivative with respect to the \(x\) of interest in (3). This derivative for any \(x^*\) is simply:
Note, in this case, we have a constant marginal effect, which makes sense because a linear regression is a linear projection of y onto X. The marginal effect can be interpreted as follows:
Interpretation: On average, a one unit increase in \(x^*\) is associated with a \(β^*\) change in \(y\).
Now the careful reader may notice that this derivative is not nearly as trivial for logit models (See below for a discussion into log-odds and odds ratios). Consider the logistic model outlined in eq. (1). The derivative with respect to any x* can be solved for using the chain and quotient rules. We can thus find the marginal effect of \(x^*\) on the probability of \(y\) occurring as follows:
Here we can see that the marginal effect is now a function of the values of \(X\). This again makes sense as the logit function is non-linear (See Figure 1). This gives us the power to evaluate the marginal effects at any combination of \(X\). However, if we want to summarize the overall marginal effects we are left with two options:
Compute the average marginal effect - This entails computing the marginal effect using (5) for every observation and then computing the mean value
Compute the marginal effect at the average - This entails plugging in the mean values of all of the explanatory variables into (5) and computing the marginal effect
There is not an immediately apparent benefit of one over the other and both provide different interpretations under different contexts. However, the average marginal effect provides the cleanest interpretation, and thus will be the one we work with for the remainder of this post.
Note that all calculations can easily be extended to compute the marginal effects not only at the average values of the explanatory variables, but at any combination of values. I will leave this for the interested reader and the code provided in the next section can be readily augmented to do so (i.e., plug in the values of each variable you are interested into (5) to obtain the marginal effect at that observation). This can provide very powerful insights into how the predictive parameter marginal effects vary by certain types of individuals/observations!
Nevertheless, the interpretation of the average marginal effect in a logit model is as follows:
Interpretation: On average, a one unit increase in \(x^*\) is associated with a {computed value} percentage point change in the probability of \(y\) occurring.
Log odds, Odds, and the Odds Ratio
Before we provide a numerical example of this in action, it is important to discuss the relationship between logit models, log odds, odds, and the odds ratios. It is quite common that logistic regression results are interpreted in terms of odds, and this is because, after some algebra, we can rewrite (1) as:
However, marginal effects in terms of log-odds is extremely removed from any intuition. Thus, one can solve for the model in terms of odds by taking the exponential of (6):
It is then commonplace that the logistic regression parameters are interpreted in terms of odds by computing the odds ratios where, using (8) and incrementing \(x^*\) by 1, we obtain:
Interpretation: On average, a one unit increase in \(x^*\) is associated with multiplying the odds of \(y\) occurring by \(\beta^*\).
In my opinion, the interpretation of these are not always as clearcut as a probability interpretation unless one has exposure to and works with log-odds, odds, and odds ratios regularly. Nevertheless, (7–9) can provide insights into the marginal effects of \(x^*\) on the log-odds, odds, and odds ratio, respectively.
OPTIONAL: Nonlinearities & Interactions
Suppose we had the two following beliefs: \(x^*\) has a quadratic relationship with \(y\) and we believe the effect to differ by gender. We can augment our logit model to include two additional engineered features as follows:
where we include the squared term of \(x^*\) and interact \(x^*\) with a dummy variable for if that individual is male or not. Thus, our interpretation of the marginal effect will now be slightly less nuanced.
Note that whenever we include an interaction term we must take care to include each variable un-interacted first in the model (i.e., also include the dummy male alone as well). Otherwise, the interaction term will eat the raw effect of gender on \(y\) when in reality the interaction term may be redundant.
Now differentiating (10) with respect to \(x^*\) we obtain:
We can now see that, due to the nonlinearities, the marginal effect will vary further depending on the value of \(x^*\) and whether that individual is male or female. This can allow us to then compute average marginal effects for males versus females by computing (11) for each male and female then taking the average for each. We can similarly compute the odds ratio as done in (9) after solving (10) in terms of odds. These examples will be left for the interested reader, and what we have covered so far should be sufficient to compute these.
The Marginal Effects in Predicting Credit Card Fraud
To demonstrate a concrete example of what we discussed above, we will utilize the following Kaggle dataset on credit card transactions with the intent of building a model to predict whether a transaction is fraudulent1. The dataset has the following variables on each transaction:
First, let’s import the data and generate summary statistics:
We will now build a logistic regression model using scikit-learn. Suppose we have already gone through the proper steps in training and validating the model and have determined the appropriate model. Our final model is as follows:
Code
features =list(fraud.iloc[:, 0:7].columns)cont_feat = features[:3]bin_feat = features[3:]normalize = ColumnTransformer( [("cont", StandardScaler(), cont_feat), ("binary", "passthrough", bin_feat)])pipeline = Pipeline([("normalize", normalize), ("logit", LogisticRegression())])# Fit Pipelinemodel = pipeline.fit(fraud[features], fraud["fraud"])# Final Modelfinal_mod = model._final_estimator
We have built our logit model to predict if a credit card transaction is fraudulent. Now let’s pivot into explaining the model parameters to understand the inner workings of the model and the subsequent role each feature plays in driving predictions. We will define a function to compute the marginal effects of the logistic regression both in terms of probabilities and odds:
Code
def logit_margeff( model: LogisticRegression, X_features: pd.DataFrame, kind: str="probability") -> pd.DataFrame:""" Calculate the marginal effects of a logistic regression model. Parameters ---------- model The trained logistic regression model. X_features The input features used for prediction. kind The type of marginal effects to calculate. Can be "probability" or "odds". Default is "probability". Returns -------- pd.DataFrame A DataFrame containing the features and their corresponding marginal effects. """ coef = model.coef_ intercept = model.intercept_if kind =="probability": logodds = intercept + X_features @ coef.T marg_effects = []for i inrange(coef.size): marg_eff = np.mean( coef[0, i] * np.exp(-logodds) / (1+ np.exp(-logodds)) **2 ).round(3) marg_effects.append(marg_eff)elif kind =="odds": marg_effects = []for i inrange(coef.size): marg_eff = (np.exp(coef[0, i])).round(3) marg_effects.append(marg_eff)else:raiseValueError("kind must be either 'probability' or 'odds'") marginal_effects = {} marginal_effects["features"] = X_features.columns marginal_effects[f"marginal_effects_{kind}"] = marg_effects df = pd.DataFrame(marginal_effects)return df
Note that line 14 is the average marginal effect calculated using (5) and line 21 is the odds ratio calculated using (9).
After we have defined this function all we have to do is feed in the logit model we have built and the matrix of features. Let’s first interpret the output in terms of probabilities:
Recall we have standardized all continuous features and thus a one unit increase corresponds to a one standard deviation increase. We will interpret the estimated average marginal effects for one continuous feature, distance_from_home, and one binary feature, used_pin_number.
Interpretation (distance_from_home): On average, a one standard deviation (65.391) increase in the distance the transaction occurred from the cardholders home address is associated with a 2.4 percentage point increase in the probability that the transaction is fraudulent.
Interpretation (used_pin_number): On average, a credit card transaction that included the use of a pin number is associated with a 32.3 percentage point decrease in the probability that the transaction is fraudulent.
I hope this post has helped you learn how to extract meaningful insights from logit model parameters. It is clear that marginal effect interpretations in terms of probabilities provide an immense amount of intuition and explainability of the predictive mechanics under a logit model framework. Generally speaking, these parameters explain how the model makes predictions as well as explain associations between the target and features. However, under additional identifying assumptions, we can make more powerful statements towards interpreting model parameters as a causal relationship between certain features and targets. I hope this post has increased your knowledge and appreciation for logistic regressions!
I appreciate you reading my post! My posts primarily explore real-world and theoretical applications of econometric and statistical/machine learning techniques, but also whatever I am currently interested in or learning 😁. At the end of the day, I write to learn! I hope to make complex topics slightly more accessible to all.
Footnotes
Dataset available on Kaggle: Credit Card Fraud (License: CC0: Public Domain)↩︎